
Your SSD decides how fast your computer starts, how quickly apps open, and how long you wait during a big file transfer or a game load screen. A benchmark tells you whether the drive is actually hitting that potential, or quietly leaving speed on the table. The whole test takes a few minutes once you know which tool to use and what the numbers mean. If you're shopping for an upgrade while you're at it, KingSpec's internal SSD lineup spans SATA and NVMe drives at every price point.
This guide walks through how to benchmark SSD speed step by step: what the numbers actually measure, how to set up a fair test, how to read your results against real-world specs, and what to do if the score comes back low.
Key Takeaways
- CrystalDiskMark is the easiest free tool for benchmarking SSD speed on Windows
- Test sequential and random read/write performance separately, they measure different things
- Close background programs and double-check the drive letter before you run a test
- Leaving some free space (many users aim for roughly 10 to 20%) helps keep performance consistent, though the ideal amount depends on your SSD model and workload
- Always compare your results against the drive's own spec sheet, connection type, and temperature, not a generic number online
- A real file transfer often tells you more about daily performance than a peak benchmark score
What an SSD Benchmark Measures

An SSD benchmark measures how fast a drive reads and writes data under a controlled, repeatable test. It's how you compare two drives fairly, confirm a new install is working correctly, or figure out why a drive suddenly feels slow.
Sequential Read and Write Speed
Sequential speed measures how fast the drive moves large, continuous blocks of data. It's the number that matters most for:
- Copying large video files
- Moving game folders between drives
- Creating full-system backups
- Transferring disk images
Read speed tells you how fast the SSD retrieves data. Write speed tells you how fast it saves data. Both numbers show up separately in every benchmark tool.
Random Read and Write Speed
Random performance measures how the drive handles many small requests scattered across different parts of the drive. This has a bigger effect on everyday computer use than sequential speed does, including:
- Starting Windows
- Opening apps
- Loading small files
- Installing software
- Managing documents
A drive can post an impressive sequential number and still feel sluggish day to day if its random performance is weak. This is exactly why NVMe drives feel snappier than SATA drives even when their sequential specs look closer than you'd expect.
MB/s, IOPS, and Latency
Benchmark tools typically show three kinds of results:
- MB/s: how much data the drive transfers each second
- IOPS: how many read/write operations the drive handles each second
- Latency: how long the drive takes to respond to a request
Higher numbers are generally better, but only compare results from the same tool and the same test settings. Switching benchmark programs mid-comparison is one of the fastest ways to draw the wrong conclusion. For a closer look at how interface generation affects these numbers, see PCIe 4.0 NVMe SSD: Speed and Performance Guide.
Prepare Before You Benchmark SSD Speed
Good prep produces a more reliable result, and it stops you from blaming the SSD for a problem that actually lives somewhere else in your system.
Identify the SSD Type and Connection
First, confirm whether you're testing a SATA SSD, an NVMe SSD, or an external USB SSD. The connection sets a hard ceiling on performance no matter how fast the drive itself is rated.
A fast NVMe drive can't hit its full speed if it's installed in a slower M.2 slot or attached through a limited adapter. An external SSD is similarly capped by its USB port, cable, and enclosure. If you're setting up a drive for the first time, How to Install Internal SSD: Quick Setup Guide covers the physical install for both form factors.
Check the Advertised SSD Speed
Find your drive's specifications on the manufacturer's product page and note the listed sequential read and write speeds, plus any random performance figures. These numbers are almost always measured under ideal lab conditions. Your own benchmark can come in lower because of your specific computer, test settings, drive temperature, free space, or background activity, and that's normal.
Set Up Accurate Test Conditions
Before you run the test:
- Close games, browsers, downloads, and file transfers
- Pause cloud backup and file-sync programs
- Avoid running Windows updates or antivirus scans during the test
- Keep a laptop plugged into its charger
- Restart the computer if a lot of programs have been running
- Let the SSD cool down before you start
Keep Free Space on the Drive
Keeping some free space available helps maintain consistent performance. Many users leave roughly 10 to 20% of the drive free, though the ideal amount depends on your SSD model, your workload, and the manufacturer's own guidance. A drive that's nearly full can show slower write performance and less room for normal maintenance tasks.
Some benchmark tools write temporary test data to the drive during the run, so double-check you've selected the correct drive before you start.
How to Benchmark SSD Speed in Windows 11

CrystalDiskMark is one of the easiest tools for testing SSD speed on Windows 11. It shows sequential and random read/write results in one simple table, and it's free.
Run a CrystalDiskMark SSD Benchmark
Here's the process:
- Download CrystalDiskMark from its official site
- Install and open the program
- Select the SSD you want to test from the drive menu
- Choose the number of test runs
- Choose a test size
- Close other programs
- Start the benchmark
- Wait until every test finishes
- Save or record your results
Three test runs are enough for a quick check. A larger test size, 4 GiB or more, gives you steadier results, though the test takes longer to finish.
Choose the Correct CrystalDiskMark Settings
A smaller test size works fine when you just need a quick read on drive health. A larger size is better when you're comparing drives head-to-head or checking whether performance holds steady over a longer run.
The test rows are usually labeled with:
- Sequential read and write
- Random 4K read and write
- Different queue depths
- Different thread counts
In CrystalDiskMark, "Q" stands for queue depth and "T" stands for thread count. Q1T1, for example, means one queued request handled by a single thread. Low-queue-depth results map closely to everyday computer use, while higher queue depths simulate heavier, more demanding workloads.
For everyday use, pay the closest attention to random 4K results at a low queue depth. For large file transfers and gaming performance, focus more on sequential read and write speed instead.
Read the Benchmark Results
Compare these four values against the drive's advertised specifications:
- Sequential read speed
- Sequential write speed
- Random read speed
- Random write speed
Don't judge an entire SSD off one number. A balanced drive with strong random performance can feel faster in daily use than a drive with a flashier advertised sequential speed.
Other Tools to Test SSD Speed
CrystalDiskMark is a great starting point, but other tools reveal different sides of storage performance. Stick to one tool consistently whenever you're comparing two or more drives.
AS SSD Benchmark
AS SSD Benchmark measures sequential speed, random 4K performance, access time, and copy performance, and it produces a single score you can use for comparison. That score only means something when the drives are tested under similar conditions. Different benchmark programs use different test methods, so scores from separate tools shouldn't be treated as directly interchangeable.
ATTO Disk Benchmark
ATTO tests a drive across a range of file sizes, which shows you how performance shifts as files get larger or smaller. It's useful for catching weak small-file performance or a write-speed drop during longer transfers. Results here can look different from CrystalDiskMark because the two programs use different workloads.
Windows Task Manager and Resource Monitor
These built-in Windows tools show live disk activity, but they aren't full SSD benchmark programs. Task Manager displays active usage, read speed, write speed, and which programs are hitting the drive right now. Resource Monitor goes a step further with more detail on disk activity and response time, which makes it useful for spotting background processes that might be interfering with a dedicated benchmark run.
Check Real-World SSD Performance
A benchmark shows performance under a controlled workload. Real-world tests show how the SSD actually behaves during the tasks you do every day.
Test a Large File Transfer
Copy a large file or folder between two fast drives. The source drive needs to be fast enough on its own, or it becomes the bottleneck instead of the SSD you're actually testing.
Record the transfer time and compare the average speed against your benchmark result. Real-world speed usually comes in lower because of file overhead, caching, the operating system, and the speed of the second drive involved.
Test Many Small Files
Copy a folder full of small files and time how long it takes. This test represents software installs, app data, documents, and development projects far better than a single large file does. Small-file transfers naturally run much slower than large-file transfers, and that doesn't automatically mean anything is wrong with the SSD.
Test App and Game Loading
Time how long it takes to start Windows, open a large application, or load a game. Run each test a few times and keep the conditions consistent between runs.
Keep in mind that processor speed, system memory, game design, and background programs all affect loading times too. Storage speed is only one piece of the result. If you're planning a broader system upgrade, KingSpec's portable SSD lineup is worth a look for adding fast external scratch space without opening the case.
Test Sustained Write Speed
Copy a large amount of data to the SSD and watch how the speed behaves over time. Some drives start fast, then slow down once their temporary write cache fills up. Temperature, available free space, drive capacity, and the type of flash memory all play a role in long writes, and a short benchmark won't reveal this behavior on its own.
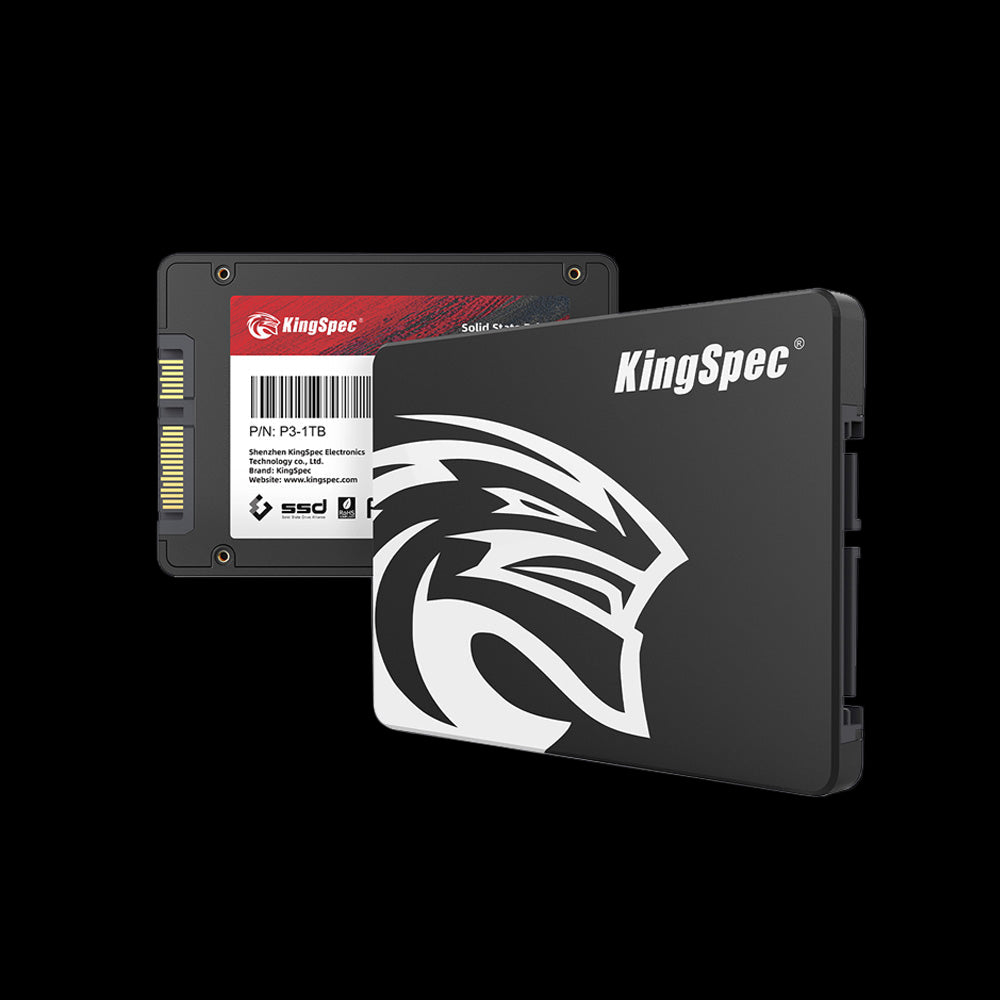
- Interface: SATA Rev.3.2 (6Gb/s)
- Read Speed: Up to 580 MB/s
- Write Speed: Up to 570 MB/s
- Capacities: 128GB up to 8TB
- NAND: 3D NAND
- Warranty: 3 Years
A drop-in replacement for an aging hard drive or first-generation SSD. Shock-resistant and quiet, with roughly 4x the speed of a traditional HDD for a straightforward, affordable upgrade.
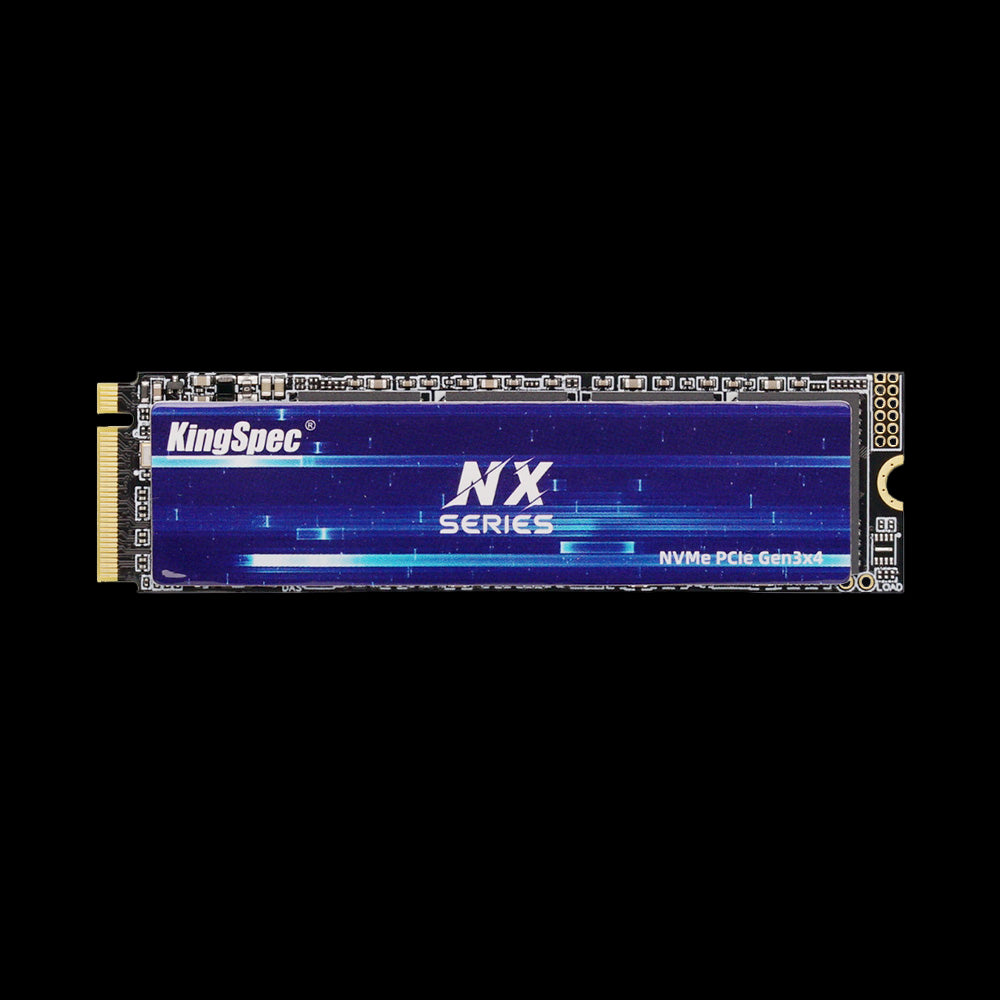
- Interface: PCIe Gen3 x4, NVMe 1.3
- Read Speed: Up to 3,500 MB/s
- Write Speed: Up to 3,200 MB/s
- Capacities: 128GB to 2TB
- NAND: 3D NAND
- Warranty: 3 Years
A budget-friendly jump into NVMe territory. The ultra-thin graphene heat-sink label keeps installs simple, and the random 4K performance holds up well for daily desktop use and light gaming.
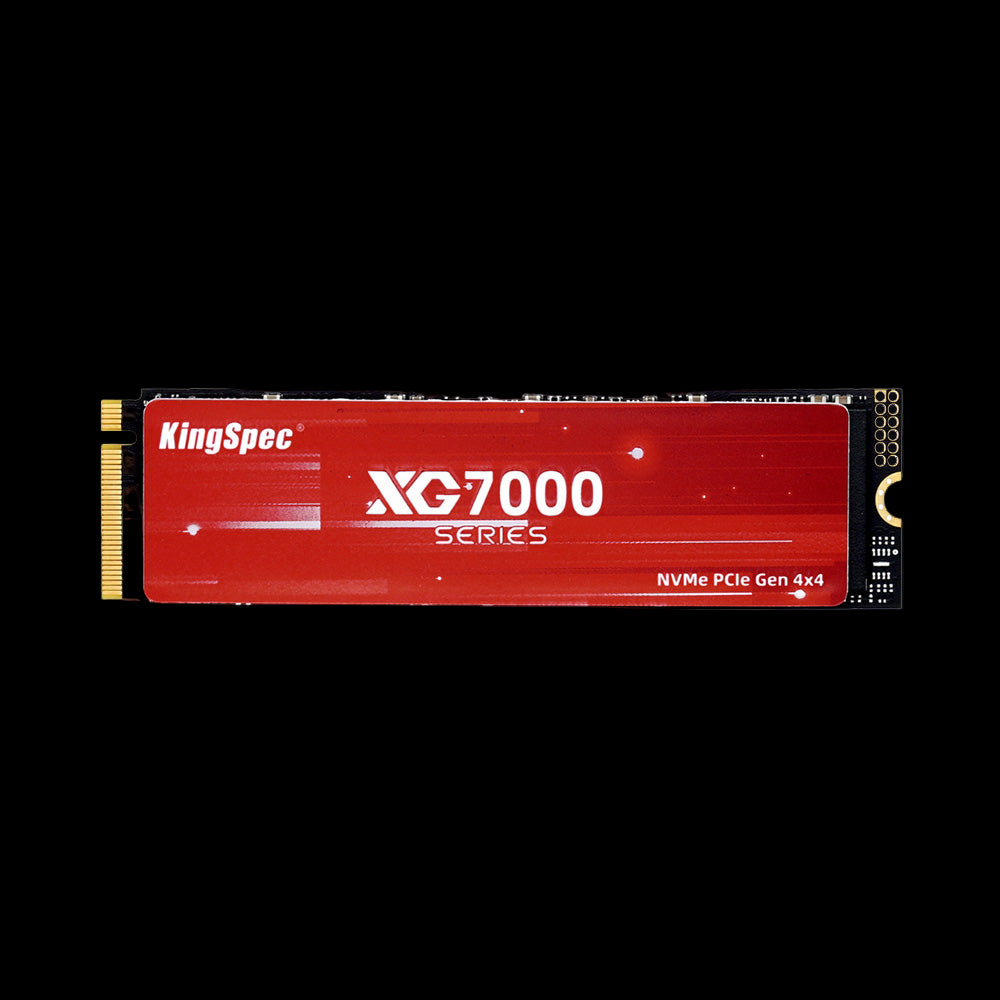
- Interface: PCIe Gen4 x4, NVMe 1.4
- Read Speed: Up to 7,400 MB/s
- Write Speed: Up to 6,600 MB/s
- Capacities: 512GB up to 8TB
- NAND: 3D NAND
- Warranty: 3 Years
A top pick for PS5 storage expansion and demanding creative work, with an ultra-thin graphene heat-sink label built in for heat dissipation under sustained load.
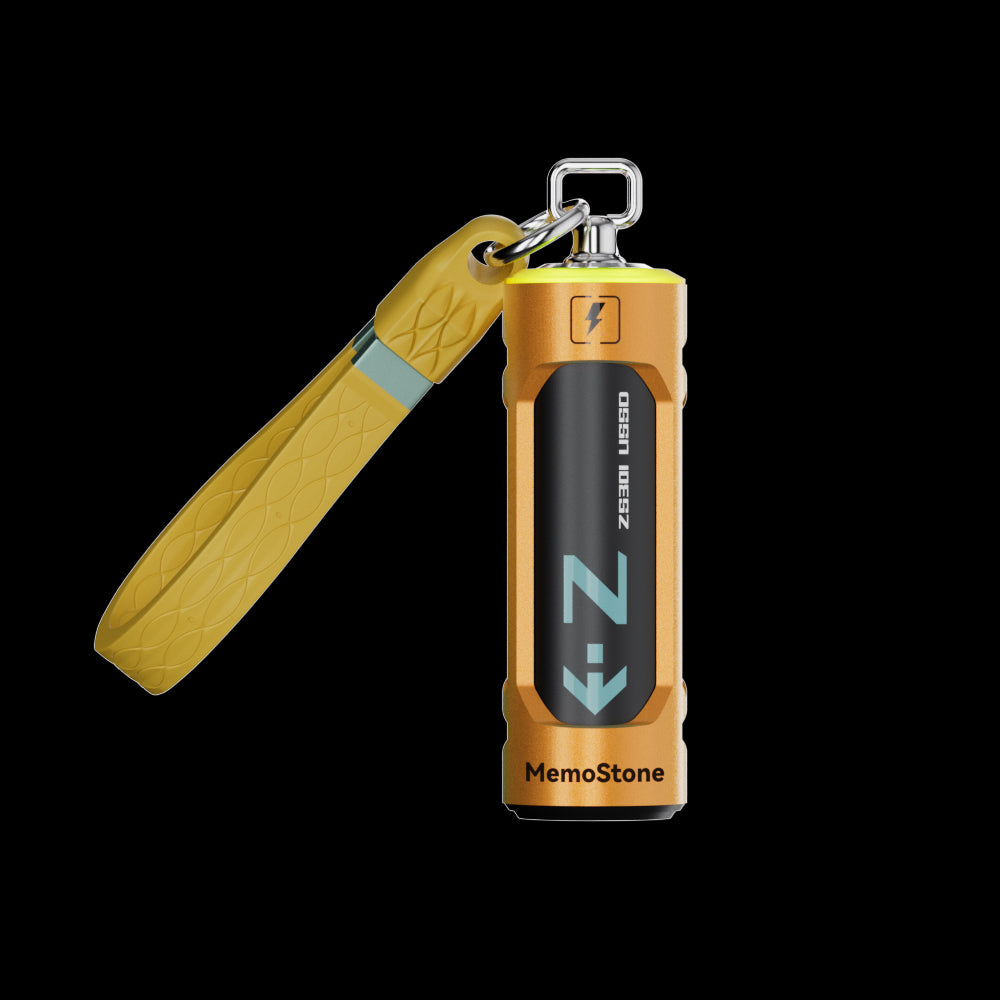
- Interface: USB 3.2 Gen2x2, 20Gbps
- Read Speed: Up to 1,900 MB/s
- Capacities: 256GB up to 2TB
- Design: Battery-shaped body with RGB glow
- Compatibility: PC, laptop, smartphone, tablet
- Warranty: 3 Years
About 4x faster than a typical external HDD, and small enough to carry a fair benchmark comparison drive with you between machines.
Compare Your SSD Results With Normal Speeds

General speed ranges can help you decide whether a result looks reasonable. Actual performance still varies by model, capacity, computer, interface, and the exact benchmark settings you used.
| SSD Type | Typical Sequential Read | Typical Sequential Write |
|---|---|---|
| SATA SSD | 450 to 580 MB/s | 400 to 570 MB/s |
| PCIe 3.0 NVMe SSD | 2,000 to 3,500 MB/s | 1,500 to 3,200 MB/s |
| PCIe 4.0 NVMe SSD | 5,000 to 7,400 MB/s | 4,000 to 6,600 MB/s |
| PCIe 5.0 NVMe SSD | 8,000 to 14,000+ MB/s | 7,000 to 12,000+ MB/s |
These are broad consumer ranges, not guaranteed speeds. Actual performance depends on the specific model, capacity, PCIe generation, system hardware, temperature, free space, and benchmark settings.
Why Your SSD May Be Slower Than Advertised
Common causes include:
- The SSD is connected through a slower interface than it supports
- The drive is nearly full
- The SSD is overheating
- Background programs are actively using the drive
- The test size or queue settings differ from what the manufacturer used
- A USB cable or enclosure is limiting an external drive's performance
- The SSD has hit the end of its write cache
- Drivers or firmware need an update
- The motherboard slot supports an older, slower PCIe generation
Check your test conditions before you assume there's a problem with the drive itself.
How to Tell Which SSD Is Faster
Test both drives with the same program, the same test size, the same run count, and the same computer. Keep free-space levels and temperatures as close to identical as you can. Then compare sequential read speed, sequential write speed, random 4K results, latency, sustained write performance, temperature under load, and real-world transfer times. The drive with the highest peak read speed isn't automatically the best option for your specific work or gaming needs.
What KingSpec's Real Numbers Look Like
It helps to see the table above next to actual drives instead of just theoretical ranges. KingSpec's P3 SATA SSD lands right at the top of the SATA tier at up to 580 MB/s read. The NX series NVMe drive sits near the top of the PCIe 3.0 range at 3,500 MB/s, and the XG7000 pushes close to the ceiling of PCIe 4.0 at 7,400 MB/s read and 6,600 MB/s write. Comparing a fresh benchmark against numbers from a real product page, rather than a rough industry average, gives you a tighter read on whether your own result is on target.
Fix Slow SSD Benchmark Results
A low score often comes from the setup rather than a failing drive. Work through these checks before you consider replacing the SSD.
Check Temperature and Cooling
Use a monitoring tool to check the SSD's temperature at idle and during a benchmark run. If performance drops as the drive heats up, thermal throttling is likely the cause. Check the heatsink, airflow, laptop cooling, and dust buildup, since NVMe drives in particular can benefit from a properly installed motherboard heatsink. SSD Temperature Range: What's Safe and Normal breaks down what counts as a healthy operating range.
Check SSD Health
Use the manufacturer's management software or a trusted health tool to review reported health status, temperature, error data, total data written, remaining life, and available spare capacity. Health values can differ between manufacturers, so don't compare them directly across brands. A speed test on its own can't confirm the full health of an SSD; for that, see How Long Do SSDs Last? Typical SSD Lifespan Guide.
Check the Connection
For SATA drives, check the data cable and the port itself. For NVMe drives, confirm the SSD is seated in the correct M.2 slot and running at its expected PCIe speed. For external drives, check the USB port, cable, and enclosure, since the slowest part of the chain controls the final result. If the drive isn't detected at all, Hard Drive Not Showing Up: Quick and Easy Fixes walks through the most common causes.
Repeat the Benchmark
Restart the computer, close background apps, let the SSD cool, and run the same test again. Look for a consistent pattern across a few runs instead of reacting to one unusual score.
Check Firmware and Drivers Safely
Firmware and chipset or storage drivers can affect both compatibility and performance. Back up important files first, and use only the SSD manufacturer's official update tool. Keep a laptop connected to power and never interrupt a firmware update mid-process. Read the manufacturer's release notes before installing anything.
SSD Benchmark Mistakes to Avoid
Watch out for these common errors when testing SSD speed:
- Selecting the wrong drive in the benchmark tool
- Using a test size that's too small to be representative
- Testing a nearly full SSD
- Running back-to-back tests without letting the drive cool
- Comparing results pulled from different benchmark tools
- Testing through a slow or unreliable USB adapter
- Using the computer heavily during the test itself
- Confusing peak sequential speed with everyday performance
- Running a destructive test without backing up important files first
Advanced storage commands can overwrite data, so only use them if you fully understand what they do. Where possible, stick to a non-destructive test or use a separate test drive. For a broader tune-up beyond benchmarking, How to Improve SSD Performance: Simple Fixes to Make Your Drive Faster covers the settings worth checking.
Conclusion
Benchmarking SSD speed is simple once you use a trusted tool, select the right drive, and keep your test conditions consistent. Check sequential and random performance separately, then confirm the result with a real file transfer or an application load test. If the score looks low, work through free space, temperature, connection speed, background activity, and drive health before you decide the SSD has actually failed.
If your benchmark confirms it's time for a faster drive, KingSpec's DDR RAM lineup is also worth pairing with a storage upgrade, since a slow benchmark result sometimes points to a memory bottleneck rather than the SSD itself. Compare capacity, interface, rated speed, endurance, warranty, and system compatibility before you buy.
Browse Related Collections
Frequently Asked Questions (FAQs):
How do I benchmark my SSD speed?
Install a trusted benchmark program, select the correct SSD, and run sequential and random read/write tests. Close background programs first for a more consistent result, then compare the numbers against the drive's own specifications and connection type.
How do I test the speed of my new SSD?
Confirm the computer detects the correct drive capacity and interface. Run a benchmark while the drive is mostly empty, record the results, then test again after copying a large amount of data. This shows you both peak and sustained performance.
What is a normal SSD speed?
A SATA SSD commonly reaches around 450 to 580 MB/s for sequential reads. NVMe SSDs range from roughly 2,000 MB/s up past 14,000 MB/s depending on the PCIe generation and model. Results can run lower because of heat, low free space, or system limits, so always check the specifications for your exact SSD.
How do I run diagnostics on an SSD?
Use a storage health tool to check temperature, error data, total data written, and remaining life. From there, run a speed benchmark to check performance. Keep in mind that a healthy speed result doesn't replace a full health check on its own.
Why does my SSD benchmark score change every time I run it?
Small variations between runs are normal and usually come from background activity, drive temperature, or how full the SSD is at the time of the test. Large swings point to a specific cause, like thermal throttling, a nearly full drive, or a background program competing for disk access. Run the test a few times under the same conditions to spot a real pattern.

